Observability
Alerting with Prometheus and Alertmanager
Install Prometheus and Alertmanager, define rules, and notify Teams and email.
July 6, 2025·CloudGenie·12 min read

Introduction
This guide installs Prometheus and Alertmanager from release tarballs and runs them under systemd on Ubuntu. For Microsoft Teams, it uses the prometheus-msteams container as a webhook bridge; email uses SMTP from Alertmanager.
Prerequisites
- Ubuntu 20.04 or later (or similar)
- Root or sudo for package and systemd units
- Docker (for prometheus-msteams if you use Teams)
- Microsoft Teams incoming webhook URL (if using Teams)
- SMTP credentials for email (if using mail)
Installing and configuring Prometheus
Download and install
Download a current Prometheus release for linux-amd64, extract, and install binaries under /usr/local/bin; create config and data directories under /etc/prometheus and /var/lib/prometheus.
wget https://github.com/prometheus/prometheus/releases/download/v2.52.0/prometheus-2.52.0.linux-amd64.tar.gz
tar xvf prometheus-2.52.0.linux-amd64.tar.gz
cd prometheus-2.52.0.linux-amd64
sudo mv prometheus promtool /usr/local/bin/
sudo mkdir -p /etc/prometheus /var/lib/prometheus
sudo cp -r consoles console_libraries /etc/prometheus/
prometheus.yml
Point alerting at Alertmanager, load rule files, and define scrape_configs for Prometheus itself and your apps:
global:
  scrape_interval: 15s
  evaluation_interval: 15s
  scrape_timeout: 10s

alerting:
  alertmanagers:
    - static_configs:
        - targets:
          - localhost:9093

rule_files:
  - "/etc/prometheus/alert.rules.yml"

scrape_configs:
  - job_name: "prometheus"
    static_configs:
      - targets: ["localhost:9090"]

  - job_name: "nodejs_app"
    static_configs:
      - targets: ["localhost:3000"]

  - job_name: "rabbitmq"
    static_configs:
      - targets: ["localhost:15692"]
Run Prometheus as a systemd service
[Unit]
Description=Prometheus
Documentation=https://prometheus.io/docs/introduction/overview/
After=network.target

[Service]
User=root
ExecStart=/usr/local/bin/prometheus \
    --config.file=/etc/prometheus/prometheus.yml \
    --storage.tsdb.path=/var/lib/prometheus/data

[Install]
WantedBy=multi-user.target
sudo systemctl daemon-reload
sudo systemctl enable prometheus
sudo systemctl start prometheus
sudo systemctl status prometheusSetting up Alertmanager
Download and install
wget https://github.com/prometheus/alertmanager/releases/download/v0.27.0/alertmanager-0.27.0.linux-amd64.tar.gz
tar xvf alertmanager-0.27.0.linux-amd64.tar.gz
cd alertmanager-0.27.0.linux-amd64
sudo mv alertmanager amtool /usr/local/bin/
sudo mkdir -p /etc/alertmanager /var/lib/alertmanager
alertmanager.yml
Replace SMTP and webhook endpoints with your environment. The webhook below targets a local prometheus-msteams listener:
global:
  resolve_timeout: 30s
  smtp_smarthost: 'smtp.example.com:587'
  smtp_from: 'alertmanager@example.com'
  smtp_auth_username: 'alertmanager@example.com'
  smtp_auth_password: 'your-email-password'
  smtp_require_tls: true

templates:
  - '/etc/alertmanager/*.tmpl'

route:
  group_by: ['alertname', 'severity']
  group_wait: 30s
  group_interval: 5m
  repeat_interval: 5m
  receiver: 'default-receiver'

receivers:
- name: 'default-receiver'
  webhook_configs:
  - url: 'http://localhost:2000/teams-webhook'
    send_resolved: true
  email_configs:
  - to: 'admin@example.com'
    send_resolved: true
Run Alertmanager as a systemd service
[Unit]
Description=Prometheus Alertmanager
After=network.target

[Service]
User=root
ExecStart=/usr/local/bin/alertmanager \
    --config.file=/etc/alertmanager/alertmanager.yml \
    --storage.path=/var/lib/alertmanager/data

[Install]
WantedBy=multi-user.target
sudo systemctl daemon-reload
sudo systemctl enable alertmanager
sudo systemctl start alertmanager
sudo systemctl status alertmanagerConfiguring alert rules
Example rules for memory, CPU, and target availability (requires node_exporter metrics for node_* expressions):
groups:
- name: example-alerts
  rules:
  - alert: HighMemoryUsage
    expr: (node_memory_MemTotal_bytes - node_memory_MemAvailable_bytes) / node_memory_MemTotal_bytes * 100 > 90
    for: 5m
    labels:
      severity: critical
    annotations:
      summary: "High memory usage on {{ $labels.instance }}"
      description: "Memory usage is {{ $value }}% on {{ $labels.instance }}"

  - alert: HighCPUUsage
    expr: 100 - (avg by(instance) (rate(node_cpu_seconds_total{mode="idle"}[1m])) * 100) > 80
    for: 5m
    labels:
      severity: warning
    annotations:
      summary: "High CPU usage on {{ $labels.instance }}"
      description: "CPU usage is {{ $value }}% on {{ $labels.instance }}"

  - alert: ServiceDown
    expr: up == 0
    for: 1m
    labels:
      severity: critical
    annotations:
      summary: "Service {{ $labels.instance }} is down"
      description: "{{ $labels.instance }} has been down for more than 1 minute"
Microsoft Teams notifications
prometheus-msteams accepts Alertmanager webhooks and forwards formatted messages to Teams. Run it on the same host (or reachable network) as the Alertmanager webhook URL.
sudo mkdir -p /opt/prometheus-msteamsconnectors:
- name: "teams-alerts"
url: "YOUR_MICROSOFT_TEAMS_WEBHOOK_URL"sudo docker run -d -p 2000:2000 \
--name="promteams" \
-v /opt/prometheus-msteams/config.yml:/tmp/config.yml \
-e CONFIG_FILE="/tmp/config.yml" \
-v /opt/prometheus-msteams/card.tmpl:/tmp/card.tmpl \
-e TEMPLATE_FILE="/tmp/card.tmpl" \
docker.io/bzon/prometheus-msteams:v1.5.2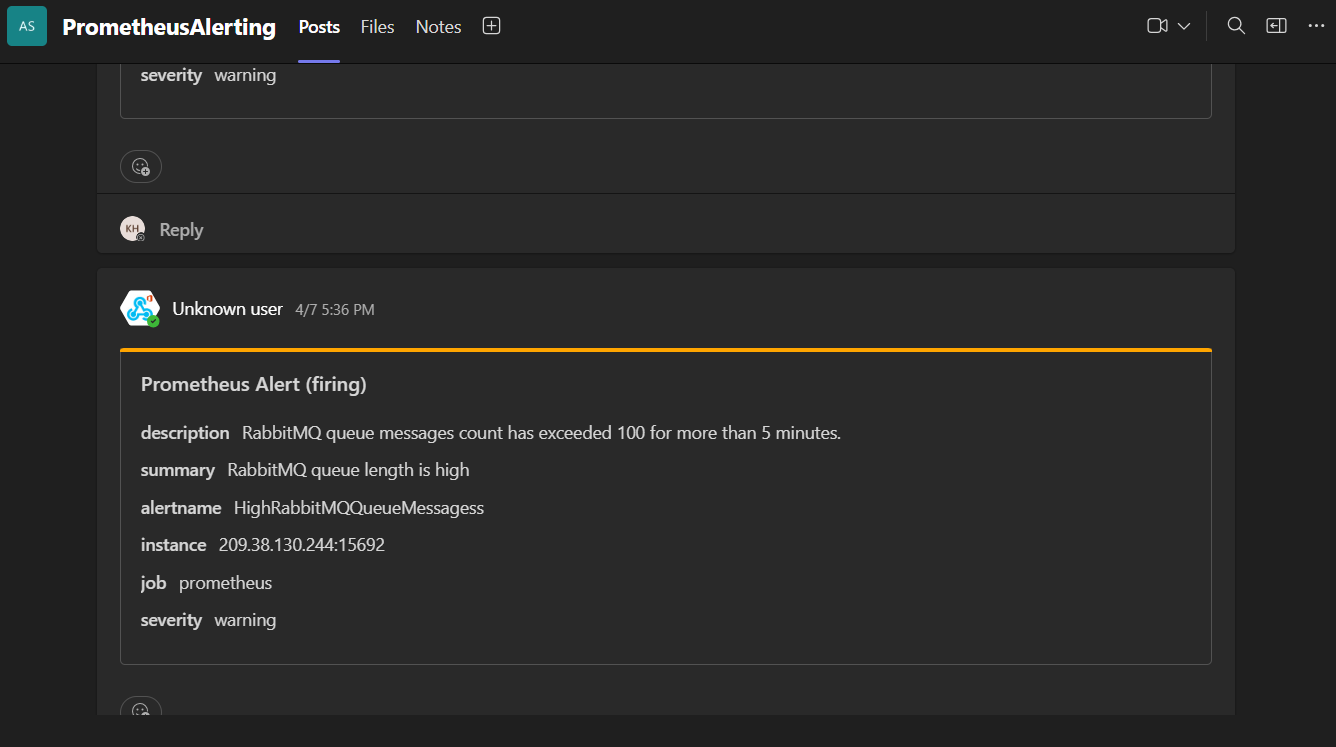
Testing
Open Prometheus (:9090) and confirm targets are UP. Open Alertmanager (:9093) and fire a test alert or wait for rule evaluation. Verify Teams and email receivers deliver messages as expected.
Conclusion
You now have metrics ingestion, routing, and multi-channel notifications. Extend with more scrape jobs, recording rules, silences, and Grafana dashboards as the stack matures.